
Power peaks: where do you start?
Understand when demand is concentrated and for how long.
Energy and power tell different stories.
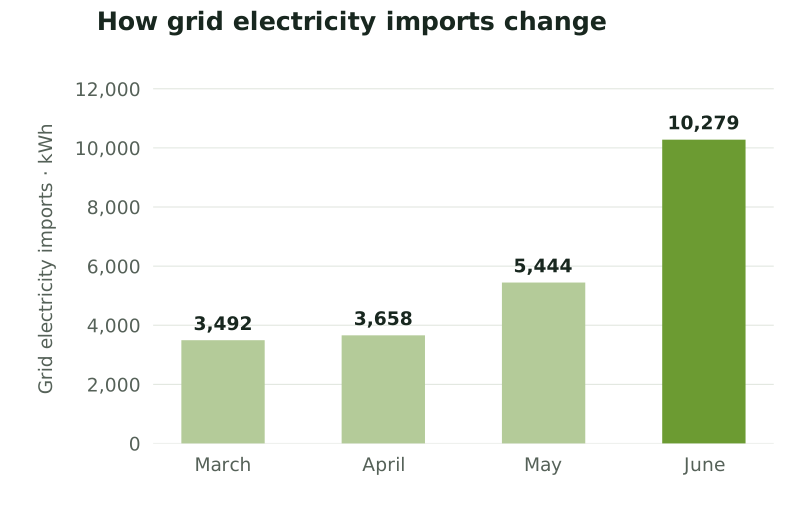
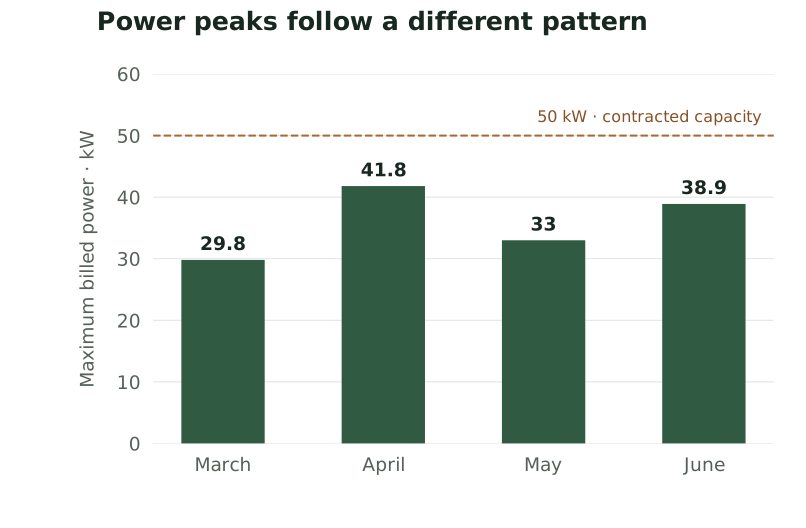
Billed data reproduced from NOAH’s technical report of 21 July 2026, section 4. Client anonymised.
Read the full case study ↗kWh and kW answer different questions.
Energy tells you how much you consumed over a period; power describes the rate of consumption. Two businesses with the same monthly kWh can have very different peaks.
Timing matters.
Load profiles connect grid demand with schedules and activities. Data frequency, peak duration and simultaneous loads are essential to understanding what is happening.
From observation to alternatives.
The comparison may lead us to examine load scheduling, controls or supply characteristics. Each solution must be assessed alongside production constraints.
FROM IDEAS TO A PROJECT
Request an assessment ↗Let’s start with your business.
Share your goals and available data: together we will identify a useful first step.